Can an LLM Generate a Tableau Workbook? Dissecting the Inside of a .twbx File and Trying It Out

Introduction
“Tableau workbooks are XML, right? If so, should it be possible to generate them automatically with an LLM?”
I started this experiment with that lighthearted thought, but it turned into a much deeper learning experience than expected, so I am sharing it here. The conclusion up front is that it is possible under certain conditions. In this article, I explain the insights gained along the way for Tableau users.
What TWB and TWBX Really Are
Tableau users have likely seen the file extensions .twb and .twbx at least once. When you look inside, they turn out to have a surprisingly simple structure.
TWB Files Are XML
A .twb file is an XML file that can be opened directly in a text editor. It contains data source connection information, worksheet definitions, and color and style settings, all described in XML format.
<?xml version='1.0' encoding='utf-8' ?>
<workbook original-version='18.1' source-build='2025.2.4' ...>
  <datasources>
    <datasource caption='Orders (Sample - Superstore)' ...>
      <!-- Datasource definition -->
    </datasource>
  </datasources>
  <worksheets>
    <worksheet name='Sheet 1'>
      <!-- Worksheet definition -->
    </worksheet>
  </worksheets>
</workbook>
TWBX Files Are ZIP Archives
A .twbx file is actually just a ZIP file. If you change the extension to .zip and extract it, you can see its contents.
sample.twbx (= ZIP)
├── sample.twb          # Workbook definition (XML)
└── Data/
    └── tableau-temp/
        └── #TableauTemp_xxx.hyper  # Extract data
With this structure in mind, it seems that in theory an LLM should be able to generate a TWBX file.
Starting the Experiment: Creating a Pie Chart
Let us start with something simple. For this experiment, I used the Sample Superstore data and set the goal of automatically generating a pie chart of sales by category.
I could have used GPT 5.1, but since this task is essentially coding, I decided to use Claude Opus 4.5 and prompted it like this. Please excuse any spelling errors since this was done with voice input.

Prompt 1 (English translation) I am using Tableau Desktop Public Edition. I understand that a Tableau TWB file is actually XML internally. I also understand that when a file includes data and is saved as a TWBX, it is simply a ZIP archive. Please refer to the XML structure of the input TWB file. For the input data, use the Sample Superstore Excel file as the data source. Based on this, please create an original TWBX file. In Sheet 1, create a pie chart showing sales by category. In the example input.twb, the chart is a bar chart, but please change it to a pie chart and color it by category. Finally, display a link that allows the completed file to be downloaded.
LLMs are generally better at imitation than at creating something entirely from scratch. Both are possible, but imitation tends to produce more stable quality. Rather than asking it to create a visualization from nothing, it seemed better to provide an existing .twb as a reference, so I attached a file.
At that point, it was unclear what the optimal input for the LLM would be. I created a workbook with a very basic bar chart and saved it as both input.twb and input.twbx. I also attached the Sample Superstore Excel file as the data source and provided all of this to Claude. This turned out to be overkill and caused various errors. In the end, the only required input was the .twbx file.
First Obstacle: Extracts Are Mandatory in Tableau Public Edition
When I tried to open the initially generated TWBX file in Tableau Public Edition, I encountered this error.

In Tableau Public Edition, TWBX files that use live connections to Excel or CSV files cannot be opened. Only TWBX files that contain a prebuilt extract converted to the .hyper format are supported.
Second Obstacle: The .hyper File Is a Proprietary Binary Format
I then thought, “Why not just convert the CSV to hyper?” However, .hyper files are a proprietary binary format specific to Tableau, so an LLM cannot generate them directly.
It is possible to generate them using the Tableau Hyper API, a Python library, but that felt like more work than necessary for this experiment. I looked for a simpler approach.
Solution: Reusing an Existing hyper File
I took a slightly sneaky approach. I decided to extract the hyper file from an existing TWBX and only rewrite the TWB XML. When I explained this to Claude, it performed the following steps.
1. Unzip an existing TWBX
2. Keep the .hyper file as is
3. Rewrite the TWB XML for a pie chart
4. Zip everything again to create a new TWBX
This worked perfectly. The pie chart rendered correctly. Very impressive.

Key Points in TWB XML
Based on this experiment, here are the key points to keep in mind when editing TWB files with an LLM.
That said, humans do not need to memorize these rules. In practice, you can just tell the LLM to “make it work nicely” and it will usually handle the details.
The extract Section Is Required
For a TWB file to work in Tableau Public, it must include an <extract> section. Without it, the workbook will fail to open.
<extract enabled='true' ...>
  <connection class='hyper'
              dbname='Data/tableau-temp/#TableauTemp_xxx.hyper'
              schema='Extract'
              tablename='Extract' ...>
    <relation name='Extract' table='[Extract].[Extract]' type='table' />
    <metadata-records>
      <!-- Metadata for each column -->
    </metadata-records>
  </connection>
</extract>
Some additional Tableau XML trivia includes the following.
- The chart type is specified by
<mark class="...">. - Color, size, and similar settings are defined in the
<encodings>section. - Which fields are placed on rows and columns is defined by
<rows>and<cols>.
You do not need to know any of this in detail. The LLM will write it for you.
Final Result: Automatically Generating a TWBX with Three Sheets
Once you can generate a file that opens correctly, everything becomes much easier. From there, you can simply ask for whatever you want. The file name v2 refers to the version that successfully generated the pie chart.

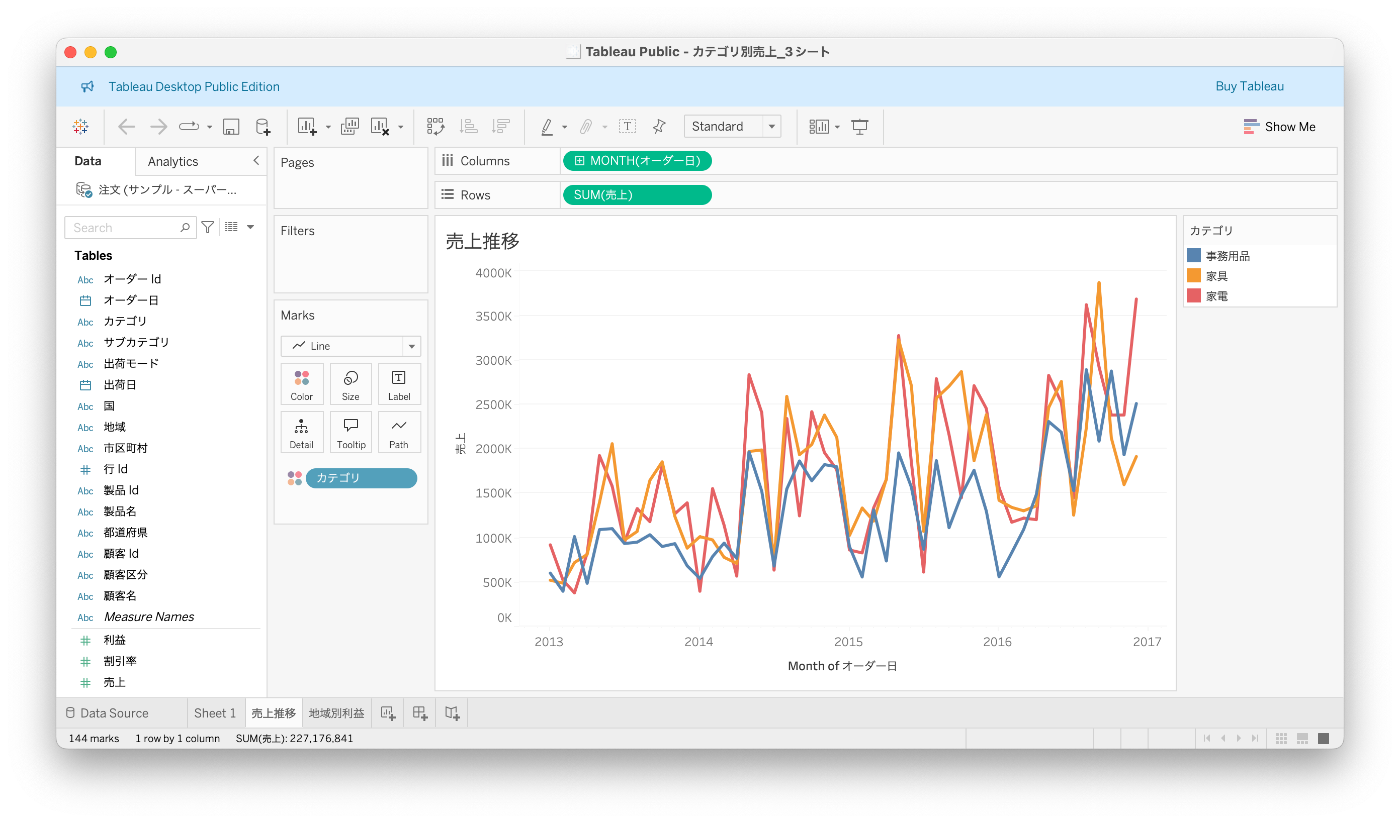
Prompt 2 (English translation) Next, for v2, add two additional sheets. One sheet should be a line chart showing the sales trend aggregated by year and month. The other sheet should be a bar chart showing profit by region. For both charts, apply color by category.
It really is possible to create visualizations using only natural language.

In the end, I successfully generated a TWBX containing the following three sheets.
- Sheet 1: Sales by category as a pie chart
- Sales Trend: Sales over time by year and month as a line chart
- Profit by Region: Profit by region as a bar chart
All sheets are colored by category.
Pitfall: Do Not Include Unnecessary Files in a TWBX
One issue I ran into during the experiment was accidentally including multiple TWB files in a single TWBX. Tableau ended up loading an old TWB without an extract section, which caused errors.
When creating a TWBX, be careful to include only the required files.
Correct structure
output.twbx
├── workbook.twb  # Only one TWB
└── Data/
    └── tableau-temp/
        └── #TableauTemp_xxx.hyper

Problematic structure with leftover files
output.twbx
├── old_workbook.twb       # This gets loaded instead
├── Sample Superstore.xls  # Unnecessary Excel file
├── new_workbook.twb
└── Data/
    └── ...
Summary: TWBX Generation with LLMs Is Possible Under Certain Conditions
What Is Possible
If you provide a .twbx file as input, an LLM such as Claude can do the following.
- Generate a new TWBX by reusing an existing hyper file.
- Add or edit sheets at the XML level.
- Change chart types, colors, and layouts.
What Is Difficult
- Creating a new hyper file from scratch, which requires the Hyper API.
- Generating a TWBX completely from zero, especially for Tableau Public.
Practical Use Cases
- Template expansion: Generate multiple variations based on an existing TWBX by changing field names or chart types.
- Automatic dashboard generation: Create workbooks that select appropriate chart types based on analysis results.
- Generating standard dashboards from specifications: Mass produce standardized visualizations based on documents that define which fields to use and what kind of charts to create.
With a well designed workflow using features like Claude Skills, it seems possible to automate a large portion of routine visualization work.
Closing Thoughts
The fact that Tableau file formats are XML based can be seen as an open design choice. Through this experiment, I realized that understanding the structure behind GUI tools opens up new possibilities for automation and efficiency.
As LLMs continue to improve, tasks that involve understanding and manipulating file formats like this are becoming increasingly accessible. It may be worth taking a look inside the file formats of the tools you use every day. You might discover something new.